shiny::runGitHub(repo = "DB7_OER/TeachingApps",
subdir = "Tools/pvalues")10 Tests of Significance
10.1 Overview of Tests of Significance
Philosophy
- We start with a “null” hypothesis, \(H_0\), which states that nothing “interesting” is going on.
- The mean is exactly what we guessed, \(H_0: \mu = \mu_0\)1
- The effect of the drug is the same in both groups.
- Something something “same as” something something.
- We have an alternative hypothesis - things are different.
- \(H_A: \mu > \mu_0\) (or \(<\), or \(\ne\))
- We do our study and get our mean (for now, assume \(\sigma\) known)
- We check if our observed mean is “too unlikely” under the null.
- If the null hypothesis is true, is our observed mean preposterous?
- This is where the dreaded p-value comes in.
- We make a decision - reject or don’t reject \(H_0\) - based on our p-value.
To summarize: We make a “guess” about the population. We collect data, and we determine whether or not our data is compatible with our guess. If it isn’t, then it’s the guess that must be wrong; not the data2.
The assumptions are the same as the assumptions for CIs:
- Normal population (or large sample size)
- \(\sigma\) known
- We will get away from this assumption later; for now it’s nice to ease into the concepts.
- Simple Random Sample (Independent Observations)
10.2 p-value by Example: Trailmaking Test for Fatigue
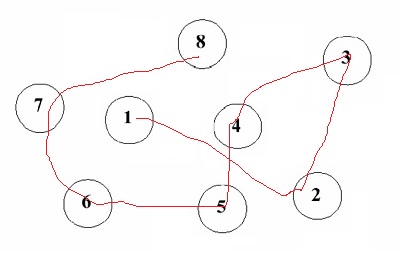
The following image shows the output of a “trailmaking” app. Subjects are shown the numbers on a touch screen and are tasked with drawing a line3 starting at 1, then 2, and so on without touching the other numbers. The time is recorded.
In my research, this app was given to aerial forest fire fighters. Flying a plane is a very challenging task to begin with, made much more challenging when there’s an active fire! The hypothesis is that pilots are measurably fatigued after a fire. However, this hypothesis must be converted into a mathematical construct that we can do something with!
Pilots perform the test many times before a long flight and once after. In samples from the aerial firefighters who were non-fatigued, it was found that completion time follows a normal distribution with mean 15 seconds and standard deviation 1.2 seconds4. We hypothesize that it took longer than that after the flight. \[\begin{align*} H_0: \mu &= 15\\ H_A: \mu &> 15 \end{align*}\] The hypotheses above are created entirely based on the research question. We can (must) write the hypothesis before collecting data. \(\bar x\) does NOT appear in hypotheses. Instead, “15” (\(\mu_0\)) and the “>” come from the hypotheses that fatigued pilots take longer than the population.
Results
We caclulated a mean of 15.9 seconds from 16 pilots. Is this slower than 15 seconds? Obviously, these numbers are different, but is this a big difference? To tell whether two numbers are “far apart”, we need some sense of scale. In statistics, scale is given to us in the form of variance.
The population standard deviation is given as 1.2 seconds. How many standard deviations away from the hypothesized value is our sample mean? Well, since it’s a SAMPLE MEAN, the standard deviation is \(1.2/\sqrt{16} = 0.3\) (again, this is also called the standard error). Our sample mean of 15.9 is 3 standard deviations5 above the hypothesized means.
The p-value for this is the probability of observing a value at least as far from the hypothesized mean, assuming that the hypothesized mean is the true mean6.
Using pnorm(), our p-value is P(Z > 3) = 1 - P(Z < 3) = 0.00137. Is our sample mean “unlikely” assuming that the null hypothesis is true?
The definition of “unlikely” will generally need to be given in the question. Usually, a significance level of \(\alpha = 0.05\)8 is used9.
Since our p-value is 0.0013 < 0.05, our observed mean is “too unlikely.” So our hypothesis must be wrong!10 We conclude that the average time to complete the trail has increased, i.e. \(\mu > 15\)11. In this case, we say our result is statistically significant.
Summary
From the question, we got our hypotheses:
\[\begin{align*} H_0: &\mu = 15\\ H_A: &\mu > 15 \end{align*}\]
We caclulated our test statistic12, which is the z-score of our observed mean assuming that the null hypothesis is true:
\[ z_{obs} = \frac{\bar x - \mu_0}{\sigma/\sqrt{n}} = \frac{15.9 - 15}{1.2/\sqrt{16}} = 0.9/0.3 = 3\]
We found up P(Z > \(z_{obs}\))13 using 1 - pnorm(3) to get our p-value of 0.0013.
Since this is a small probability (our p-value is less than our significance value of \(\alpha = 0.05\)), we reject the null hypothesis in favour of the alternative.
This is the general approach to hypothesis testing: hypotheisize, calculate, find a normal value, then conclude.
10.3 Two Sided p-values
If your hypotheses are:
\[\begin{align*} H_0: &\mu = 15\\ H_A: &\mu \ne 15 \end{align*}\]
then you’re going to need to change things. In particular, you need to double the p-value for a one-sided test14. This is where the phrase “at least as extreme” comes in - we would reject anything this far away on either side.
The following shiny app demonstrates this. In particular, note what happens when you have a two sided alternative hypothesis and you double the wrong tails15.
Two Sided Example
Given \(\sigma = 2\), \(n = 25\), and \(\bar x = 6.6\), test the hypothesis that the true population mean is not equal to 6 at the 10% level16.
\[\begin{align*} H_0: \mu = 6\\ H_A: \mu \ne 6 \end{align*}\]
test stat: \(z_{obs} = \frac{6.6 - 6}{2/\sqrt{5}} = \frac{0.6}{0.4} = 1.5\)
Find using R: P(Z > 1.5) = P(Z < -1.5) = pnorm(-1.5) = 0.0668
p-value = 2*0.0668 = 0.1336
Conclude: p > \(\alpha\), therefore do not reject. The p-value is not significant.
Critical Values
For a two-sided test at the 5% level, what is the largest test statistic that would not be rejected?
Since it’s a two-sided test at 5%, we would reject anything in the 2.5% area in either tail. Using the Z-table (or qnorm(0.05/2)), this would come from a test-statistic of 1.96. So if our test stat is 1.97, it would have a p-value below 0.05, and if it’s 1.95 it would have a p-value above 0.05.
In hypothesis testing, the critical value denotes the point at which z statistics17 are significant. If your z statistic is larger than 1.96, it will be statistically significant at the 5% level (for a two-sided test). This way, we can test significance without even calculating the p-value. Our conclusion will simply be that \(p<0.05\), but this is often sufficient - it’s not important if the p-value is 0.044 versus 0.045.18
Hard Exam-Style Question
- A study reported that their two-sided p-value for \(H_0:\mu = 0\) was significant at the 5% level, but not the 1% level.
- They reported a mean of 10 and a sample size of 36
What values could their standard deviation be?
Solution:
- At the 5% level, \(z^* = 1.96\), so:
- \(1.96 = \frac{x - \mu_0}{\sigma/\sqrt{n}} = \frac{10 - 0}{\sigma/6}\)
- Rearranging, \(\sigma= \frac{6*10}{1.96} = 30.61\)
- Sanity check:
pnorm(10, 0, 30.61/sqrt(36))= 0.975, as expected.
- At the 1% level, \(z^*\) =
-qnorm(0.01/2)= 2.576- \(\sigma= \frac{6*10}{2.576} = 23.292\)
- Sanity check:
pnorm(10, 0, 23.292/sqrt(36))= 0.995, as expected.
Conclusion: The standard deviation is between 23.3 and 30.6.
In this example, notice how a smaller standard deviation means a smaller significance level!
CI vs. p-value
Recall the following two facts:
- CI: \(\mu\) is in the interval \(\bar x \pm z^*\sigma/\sqrt{n}\)
- Test statistic: \(z_{obs} = \frac{\bar x - \mu_0}{\sigma/\sqrt{n}}\)
As homework, rearrange the test statistic equation for \(\mu_0\).
A new definition of confidence intervals: A \((1-\alpha)\)% CI contains every \(\mu_0\) that would NOT be rejected by a test at the \(\alpha\)% significance level.
This is why we don’t say that we “accept” the null hypothesis. There are an infinite number of hypothesis values in the CI - we can’t “accept” them all! Also, our tests only work in reference to the alternate hypothesis. We can only reject/not reject in reference to \(H_A\).
10.4 Self-Study Questions
- Explain the logic behind hypothesis testing in your own words. Make particular reference to the “at least as extreme as” part of the definition of a p-value.
- Explain why p-values are sample statistics.19
- What happens if a sample or study design is biased? In particular, suppose that the sample will systematically result in higher values that the population, and we’re testing \(H_A:\mu > \mu_0\). What happens to the p-value?20
- For CIs, I was adamant that we cannot speak of the probability that the population mean is inside the interval. We have now learned about the duality of CI and Hypothesis Testing, but we can speak of probability for test statistics21. What gives?22
- Suppose we are testing \(H_A:\mu > 10\) and we get a sample statistic \(\bar x = 10\). What would the p-value for this be?
- For a one-sided hypothesis test, what does it mean for our p-value to be larger than 0.5? Does this mean we did something wrong?23
10.5 Exercises
- Suppose we know that \(\sigma = 10\) and that the population is normally distributed, but we don’t know the mean. We found a sample mean of 150 from a sample of size 25. Test the hypothesis that \(\mu_0 < 155\) at the 5% level.
Solution
pnorm(150, mean = 155, sd = 10 / sqrt(25))[1] 0.006209665Since \(p<\alpha\), we reject the null hypothesis and conclude that the population mean is less than 155.
- A pharmaceutical company is testing a new drug designed to lower cholesterol levels. In a clinical trial with 80 participants, the average reduction in cholesterol is found to be 15 mg/dL and the population standard deviation is known to be 5 mg/dL. The company claims that the drug will reduce cholesterol by at least 12 mg/dL on average. Calculate the p-value for this claim based on the sample data, and determine whether there is sufficient evidence to support the company’s claim at a significance level of 0.05. Interpret the results in the context of the study.
Solution
1 - pnorm(15, mean = 12, sd = 5/sqrt(80))[1] 4.012556e-08We reject the null hypothesis that the reduction in cholesterol is exactly 12 mg/dL in favour of the alternative that the reduction in cholesterol is less than 12 mg/dL. In other words, 15 is a statistically significantly larger reduction than 12.
10.6 Crowdsourced Questions
The following questions are added from the Winter 2024 section of ST231 at Wilfrid Laurier University. The students submitted questions for bonus marks, and I have included them here (with permission, and possibly minor modifications).
- A pharmaceutical company asserts that their latest pain relief drug reduces the average duration of headaches by at least 30 minutes. To test this claim, a researcher conducts a study and gathers data from a sample of individuals suffering from headaches who took the medication. The null hypothesis (H0) states that the drug reduces the duration of the headache by exactly 30 minutes, whereas the alternative hypothesis (H1) states that it reduces it by more than 30 minutes. The research conducts a hypothesis test and obtains a p-value of 0.03. What inference should the research make at the significance level of 0.05.
- Fail to reject the null hypothesis; there is insufficient evidence to conclude that the drug reduces headache duration by 30 minutes on average.
- Fail to reject the null hypothesis; there is sufficient evidence to conclude that the drug does not reduce headache duration by 30 minutes on average.
- Reject the null hypothesis; there is sufficient evidence to conclude that the drug reduces headache duration by 30 minutes on average.
- Reject the null hypothesis; there is insufficient evidence to conclude that the drug reduces headache duration by 30 minutes on average.
Solution
c is the correct answer - since the p-value, 0.03 is less than the significance level, 0.05, the null hypothesis is rejected. This also means that there is sufficient evidence to conclude that the drug does reduce headache by at least 30 minutes on average, supporting the company’s claim.
- A basketball coach refutes the claim that the average player scores 15 points per game. Which hypothesis is used to test the claim?
- \(H_0: \mu = 15, H_A: \mu \ne 15\)
- \(H_0: \mu \ne 15, H_A: \mu = 15\)
- \(H_0: \mu > 15, H_A: \mu \le 15\)
- \(H_0: \mu \ge 15, H_A: \mu > 15\)
Solution
The correct answer would be (a). The null hypothesis (\(H_0\)) in option (a) states that the average player scores exactly 15 points per game, which is the claim being tested by the basketball coach. The alternative hypothesis (\(H_A\)) would then be that the average player does NOT score exactly 15 points, which has been modeled by the HA in option (a). This also means that the player could score less or more than 15 points per game (allowing for a two-tailed test, which has been discussed in our lesson regarding tests of significance).
- A researcher conducts a study to determine if a new dietary supplement has an effect on blood pressure compared to placebo. After a randomized controlled trial, the researcher calculates a p-value of 0.03. If the researcher set the significant at 0.05 for a two-sided test, which of the following is the correct interpretation of the result?
- There is a sufficient evidence to conclude that the supplement significantly increases blood pressure, as the p-value is less than 0.05
- There is insufficient evidence to conclude that the supplement has an effect on blood pressure, as the p-value is less than 0.05.
- There is sufficient evidence to conclude that the supplement has a significant effect on blood pressure, but it cannot be determined from the p-value alone if the effect is an increase or decrease. d.The p-value indicated that the supplement has no effect on blood pressure, as it is lower than the significance level
Solution
The correct answer is C) because in a two-sided hypothesis test, the p-value is used to assess the strength of the evidence against the null hypothesis. A p-value of 0.03 indicated that there is a 3% probability of observing the study results, or more extreme , if the null hypothesis were true. Since this p value is less than the significance level of 0.05, the null hypothesis is rejected, suggesting a significant effect of the supplement on blood pressure. However, because the test is two-sided, the p-value alone does not indicate the direct effect (increase or decrease in blood pressure).
- In a study investigating the effectiveness of a new teaching method on student performance, a hypothesis test is conducted. The null hypothesis states that the new teaching method has no effect on student performance, while the alternative hypothesis states that the new method improves performance. The significance level (\(\alpha\)) is set to 0.05 for a one-sided test. If the calculated test statistic is 1.8 and the critical value from the Z-table is 1.645, which of the following conclusions is correct?
- Fail to reject the null hypothesis because the test statistic is less than the critical value, indicating no significant improvement in student performance.
- Reject the null hypothesis because the test statistic is greater than the critical value, indicating a significant improvement in student performance.
- Fail to reject the null hypothesis because the test statistic is greater than the critical value, suggesting the data are not sufficiently extreme to indicate a significant improvement.
- Reject the null hypothesis because the test statistic is less than the critical value, suggesting the new teaching method significantly decreases student performance.
Solution
The correct answer is (b) Reject the null hypothesis because the test statistic is greater than the critical value, indicating a significant improvement in student performance. In hypothesis testing, if the calculated test statistic is greater than the critical value in a one-sided test (with the alternative hypothesis suggesting an increase), it indicates that the observed data are sufficiently extreme to reject the null hypothesis at the set significance level. Here, since 1.8 (test statistic) > 1.645 (critical value) at \(\alpha\) = 0.05, we have sufficient evidence to reject the null hypothesis and conclude that the new teaching method has a statistically significant positive effect on student performance. The conclusion is based on the premise that higher test statistics compared to the critical value indicate results that are not likely to occur under the null hypothesis.
- Dr. Lorna conducts a study to determine if a new drug reduces blood pressure more effectively than the current standard treatment. After a carefully controlled trial, she computes the p-value of the observed effects. Which of the following statements best interprets the meaning of a p-value of 0.03 in the context of this study?
- There is a 3% probability that the new drug is effective in reducing blood pressure.
- There is a 97% chance that the new drug does not reduce blood pressure more effectively than the current standard treatment.
- The probability of observing the data, or something more extreme, if the new drug has no better effect than the current standard treatment, is 3%.
- The new drug reduces blood pressure by 3% more than the current standard treatment.
Solution
The correct answer is (c) The probability of observing the data, or something more extreme, if the new drug has no better effect than the current standard treatment, is 3%.
Explanation: The p-value is a measure of the strength of evidence against the null hypothesis. It quantifies the probability of observing the collected data if the null hypothesis were true. In this context, a p-value of 0.03 suggests that there is only a 3% probability of observing this size difference in blood pressure reduction between the new drug and the standard treatment. This low p-value suggests strong evidence against the null hypothesis, indicating that the new drug might indeed be more effective than the current standard treatment. The other options misinterpret the concept and meaning of the p-value.
- The vitamin C content in tablet supplements of a certain brand is advertised to be an average of 500 mg. A researcher wonders if the actual mean vitamin C content is lower than the advertised value. To investigate, the researcher collected a random sample of 30 tablet supplements from this brand and calculated their average vitamin C content to be 456 mg. Which hypothesis is used to test the claim?
- \(H_0: \mu = 500, H_A: \mu > 500\)
- \(H_0: \mu = 500, H_A: \mu < 500\)
- $H_0: < 500, H_A: $
- \(H_0: \mu \apporx 500, H_A: \mu < 500\)
- \(H_0: \mu < 500, H_A: \mu = 500\)
Solution
The correct answer is B: the null hypothesis (H0) asserts that the average vitamin C content in the tablet supplements is 500 mg, which is the claim made by the brand and being tested by the researcher. The alternative hypothesis (Ha) suggests that the average vitamin C content in the tablet supplements is less than 500 mg, which is the (alternative) claim proposed by the researcher.
Notation note: \(\mu_0\) will always refer to the proposed population value.↩︎
Unless it’s a bad sample/study design↩︎
“trail”↩︎
These numbers actually come from the data of pre-flight trails, but we’re going to treat them as the population for now.↩︎
15.9 is 3 steps of 0.3 above 15; (15.9 - 15)/0.3 = 3↩︎
This is the definition. The description must always include the part about “assuming that the hypothesized value is the true value”↩︎
We can only use a standard normal distrubution because the mean of the sampling distribution is assumed to be \(\mu_0\), our hypothesized mean. If this weren’t the case, then we would not get a standard normal distribution and thus we wouldn’t be able to use this method. This is why the “assuming the null is true” bit is important.↩︎
The symbol \(\alpha\) refers to the significance level, but also comes up in a \((1-\alpha)\)%CI. Perhaps this is foreshadowing.↩︎
Please read the ASA’s statement on p-values. A previous short answer question exam question was based on this.↩︎
Again: if our guess is incompatible with our data, then it’s our guess that’s wrong, not the data.↩︎
Notice how this conclusion brings back the context of the question.↩︎
Labelled \(z_{obs}\).↩︎
We used \(>\) rather than \(<\) because \(>\) appears in our alternate hypothesis.↩︎
If you do this and find a p-value that is larger than 1, you used the wrong tails!↩︎
In the app, it’s denoted “Use absolute value”. This is because you can find \(P(Z > |z_{obs}|)\) so that you always get the upper tail↩︎
That is, at the \(\alpha=0.1\) significance level.↩︎
\(z_{obs}\)↩︎
If we had taken a different sample, we would have gotten a different p-value - p-values have a sampling distribution as well!!!↩︎
This implies that p-values have sampling distributions!↩︎
While you’re at it, what happens to the CI?↩︎
“p-value” is literally short for “Probability Value”.↩︎
Hint: what are we calculating probabilities for?↩︎
Hint: refer to the previous question.↩︎