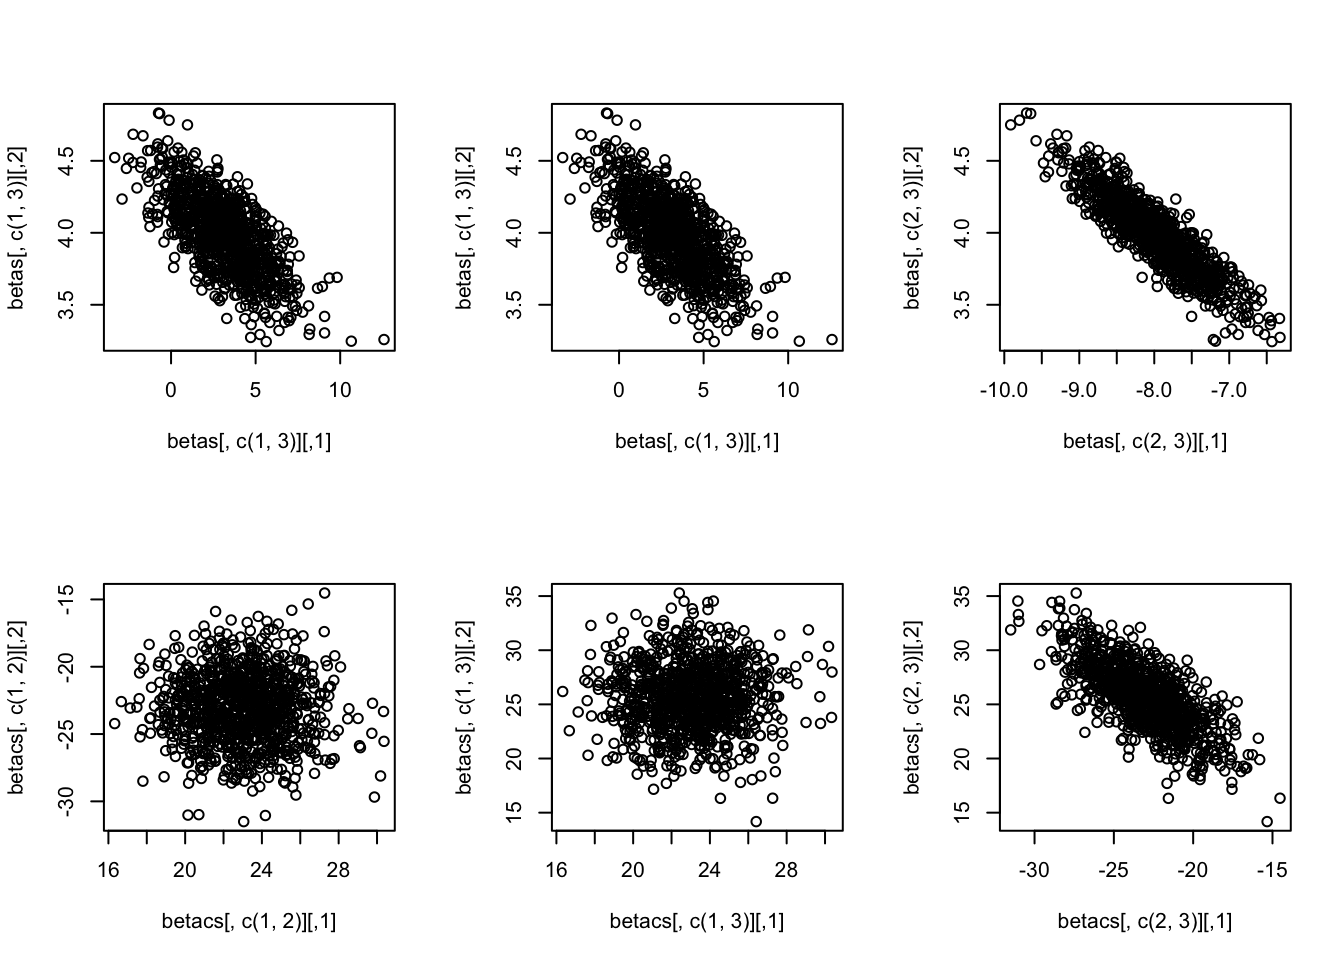
Show the code
n_sim <- 1000
n <- 30
betas <- matrix(ncol = 3, nrow = n_sim)
betacs <- betas

for (i in 1:n_sim) {
    x1 <- runif(n, 0, 10)
    x2 <- runif(n, 0, 10) + 2*x1
    y <- 3 - 8*x1 + 4*x2 + rnorm(n, 0, 4)
    betas[i, ] <- coef(lm(y ~ x1 + x2))

    x1c <- scale(x1)
    x2c <- scale(x2)
    betacs[i, ] <- coef(lm(y ~ x1c + x2c))
}

par(mfrow = c(2, 3))
plot(betas[, c(1,3)])
plot(betas[, c(1,3)])
plot(betas[, c(2,3)])
plot(betacs[, c(1,2)])
plot(betacs[, c(1,3)])
plot(betacs[, c(2,3)])